On the causal pitfalls of using predictive models for decision making
Author
Matt Bowers
Published
November 11, 2026
The Purpose of Data Science
Every once in a while my mom asks me if I can re-explain to her what data scientists do. It’s a great question really—we in the field should ask ourselves more often. In a single sentence I’d say: the purpose of data science is to create value from data. And what’s valuable to the organizations we serve? Well an organization has goals, and in order to achieve those goals it needs to make decisions about which actions to take. At its most effective, data science is about decision intelligence—informing a decision making process to help achieve desired outcomes. These decisions come in many forms, from executive deliberation on strategic bets to streaming automations occuring millions of times per day.
Examples include: * What price to charge for this ride share trip? * Which product to recommend to this user? * What treatment to give this pneumonia patient?
Behind each of these decisions is a set of “what if” questions of the form: What would happen if I did this? What would happen if I did that? To inform the decision we could predict answers to these what if questions.
For data scientists of my generation who spent the early part of their careers getting good at machine learning, this probably sounds an awful lot like a supervised learning problem. We could follow the typical ML playbook and train a model that minimizes out of sample prediction error. That means it would be the best predictor of outcomes from actions and an ideal “what if” function to use in our decisions, right?
Well, maybe; maybe not.
There is a key difference between a predictive model and the kind of “what if” function we want for decision making that I call the prediction-decision gap.
Predictive models tell us the expected outcome given what we observe, while decisions require knowing the expected outcome given that we take a certain action.
Using well-fitting statistical models or accuracy-maxing ML models for decision making can fail, not just slightly, but catastrophically. Many of these failure modes arise from errors in reasoning about what causes what and how. In this post we’ll look at two types of prediction-decision failure modes that can occur because of mishandling causality. The first is about the consequences of misreading the causal mechanisms behind the correlations we exploit for prediction, and the second is about how a model can undermine itself by changing the process that generated its own training data. The key idea is that using statistical or ML models for decision making requires careful causal reasoning, and lucky for you, this is the first post in a forthcoming series on Causal Inference.
So let’s kick this series off by seeing some of the scary things that can happen when we naively use predictive models for decision making.
Prediction-Decision Failure Modes
Correlation does not imply causation — except when it does
We’ve all had it drilled into our heads — correlation does not imply causation — meaning it isn’t possible to deduce a cause-and-effect relationship between two events solely on the basis of an observed correlation or other statistical association between them. This does not mean there isn’t a cause effect relationship between the correlated variables; it just means we can’t tell what kind of relationship it is. To put a finer point on this, consider Reichenbach’s Common Cause Principle, which states that if two events are correlated, there must either be a causal relationship between them or a third event that causes both. That means that a true correlation between two variables tells us that one causes the other, the other causes the one, or another variable causes both. Note that Tyler-Vigen-style “spurious correlations” (found by chance when dredging for high sample correlations between small samples of unrelated variables) don’t count as “true” correlations here, since they arise from sampling noise or shared time trends.
So in a sense, correlation does imply causation, but alone it cannot tell us which causal relationship exists between the variables. Let that sink in, this means that no matter how much observed data we collect, without bringing in additional assumptions, it’s not possible from the data alone to determine which variables are causes and which are effects. Furthermore, since predictive models simply leverage correlations and associations among variables from a sample of training data, a predictive model cannot tell us what causes what. This isn’t a problem for prediction, but in decision making, what causes what is absolutely critical. Operating with the wrong causal mechanism in mind can lead us to make misguided, suboptimal, or even terrible decisions.
Failure Mode 1: misreading the mechanism
Suppose we’re looking at some app usage data, and we want to figure out whether notifications can help to increase user engagement.
notifications: user enables push notifications during their first two weeks.
sessions: engagement, measured by the number of sessions in the first two weeks.
The data shows a strong positive correlation between notifications and sessions. We build a predictive model that predicts higher engagement when users have notifications enabled. Our goal is to increase engagement, and we need to make a decision about how to do that — specifically, should we prompt every new user on day 1 to turn notifications on? Well the model predicts that more users with notifications enabled gives more engagement, so naively using the predictive model as our “what if” function, we’d decide to go ahead and prompt every user to enable on day 1. There are many different causal mechanisms that could produce the observed correlation between notifications and sessions; let’s look at a few of them and what it would mean for our prediction-based decision to prompt users on day 1.
1. Notifications cause sessions
Suppose notifications remind people to come back, so each enabled user opens the app more often.
A causal diagram showing that notifications causes sessions. If you’re unfamiliar with causal diagrams, just read arrows as pointing from cause to effect
If we prompt users on day 1, sessions go up — we made the right decision!
2. Reverse causation: sessions cause notifications
Suppose the default OS notification permission prompt automatically fires after a user’s 5th session. Engaged users with many sessions see the prompt and many of them accept, while users who only open the app a few times never see it and thus few of them enable notifications. Suppose further the notifications themselves have no effect on sessions.
Under this mechanism, sessions cause the prompt to fire, which causes notifications. If we prompt users to enable notifications on day 1, sessions won’t actually increase.
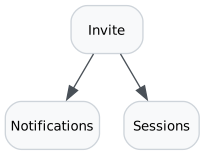
3. Common cause: invites cause notifications and sessions
Suppose many users discover the app through an invite link sent by a friend. They enable notifications to get updated on what their friends are doing, and they also use the app more than non-invite users because of that social pull. Again, notifications don’t actually increase engagement.
If we prompt users to enable notifications on day 1, more non-invited users enable notifications, but this doesn’t actually affect engagement.
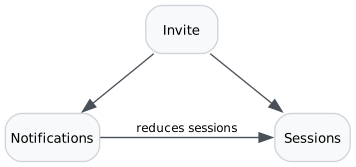
4. Common cause with annoying notifications
Suppose we have the same common cause mechanism as before but now the notifications are actually slightly annoying to users, causing a small reduction in engagement.
Note that because the tendency of invite to increase both notifications and engagement is stronger than the tendency of notifications to reduce sessions, we’ll still see that positive correlation between notifications and sessions in the data and predictive model. If we prompt users to enable notifications on day 1, we actually end up decreasing engagement.
To recap, here’s the effect of prompting to enable notifications for each of the potential causal mechanisms:
Causal Mechanism
Effect of Prompting Notifications
notifications → sessions
sessions go up
reverse causation: sessions → notifications
no impact on sessions
common cause: notifications ← invite → sessions
no impact on sessions
common cause with annoying notifications
sessions go down
Under all four of the causal mechanisms for our notifications example, the data and predictive model would show a positive correlation between notifications and sessions, but choosing to prompt users to enable notifications on day 1 would only help under the first one. Under the second and third we’d produce no effect and under the fourth we’d actually achieve the exact opposite of what we intended.
Failure mode 1 boils down to misreading the true causal mechanisms, thereby incorrectly measuring the true effect of the action on the outcome ; this produces a misleading “what if” function which then misguides our decision.
Failure Mode 2: model deployment changes the environment
To make matters worse, even if we know the true direction of the causal effect of the action on the outcome, predictive models can still lead us astray when we deploy them to guide policy decisions. Admitedly it seems natural to use a predictive model as the “what if” function behind such a policy, e.g. irrigate crops when the model predicts low soil moisture, salt roads when the model predicts slippery conditions, admit the patient to intensive care when the model predicts high risk. But when we do this, model deployment can actually change the environment in ways that invalidate the statistical associations the model learned in training.
Triaging pneumonia patients
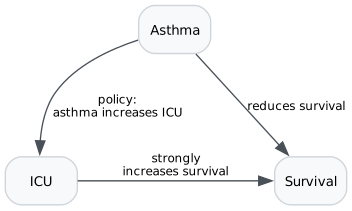
In the mid 1990s, Cost-Effective HealthCare funded a study that sought to use machine learning models to predict pneumonia risk using patient attributes like age, blood pressure, and whether they had asthma (Cooper et al. 1997, Caruana et al. 2015). Here we’ll look at a stylized version of the story; check the paper for the real details. The goal was to reduce healthcare costs by using these predictions to triage patients, deciding whether they should be admitted to the intensive care unit (ICU) or treated in the general ward. While asthma is known to increase mortality in pneumonia patients, counterintuitively, these models learned that having asthma was predictive of increased patient survival probability. Why?
In the instances from the training data, providers had correctly identified the asthma patients as high-risk pneumonia cases and sent them to the ICU. Intensive care then greatly increased their survival probability. This induces a positive correlation between asthma and survival in the dataset. Since the dataset contained patient attributes but not details about their care, ICU remained unobserved, and the predictive models learned the positive association between asthma and survival.
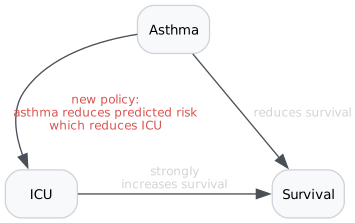
Imagine what would happen if we actually deployed this model, replacing the previous policy of provider triage with a policy based on the model’s risk prediction.
The model would indicate asthma patients are low risk and should therefore not be sent to the ICU — a potentially catastrophic mistake.
In this failure mode, we may actually know the correct causal mechanisms and treatment effect (ICU increases survival). Yet because the model is trained under a certain policy (asthma patients are sent to the ICU), the relationships it learns between the contextual variables (asthma) and the outcome (survival) are only valid under that policy. When we change this policy by using the model predictions to guide it instead, we can break the relationships the model relied on for prediction, and this can lead us to make misguided, suboptimal, or even catastrophic decisions.
The case for causality
We’ve seen that decision making is inherently causal — we take action so that the efffect serves the desired outcome. Determining the right action involves asking a “what if” question that looks a lot like a prediction problem, but predictive models are not necessarily causal; they are based on statistical associations and correlations among variables in their training data. We’ve seen two types of failure modes where use of predictive models for decision making can go wrong, both of them lead to models that incorrectly answer their “what if” questions because of causal errors. In the first mode, we misjudge what the action does by misreading the actual underlying causal mechanisms. In the second mode, we know the action helps, but the model learns the relationship between context and outcome with the old policy silently baked in; deploying the model changes the policy, which invalidates what the model learned in training.
Don’t succumb to these and other pitfalls. Become a savvy causal inference practitioner instead.
Join me through the rest of this series on causal modeling in data science. In the series we’ll cover: what exactly is causality, the potential outcomes tradition, the graphical models tradition, why there are two causality traditions, where causal modeling fits in the data science stack, and how to efficiently learn all this causality stuff. This series has been a long time in the making, mostly because causal inference is hard, and it’s taken me a long time to wrap my head around it enough to explain it cogently. So, dear reader, I’m very excited to finally bring this series to you. See you there!
Resources
Here are a couple of excellent references on the gap between prediction and causality. Check them out.